Core Web Vitals in 2026: what actually moves LCP on a real site
We rebuilt six sites for Largest Contentful Paint this year. Four changes accounted for almost all of the improvement — and none of them was the one clients expected.
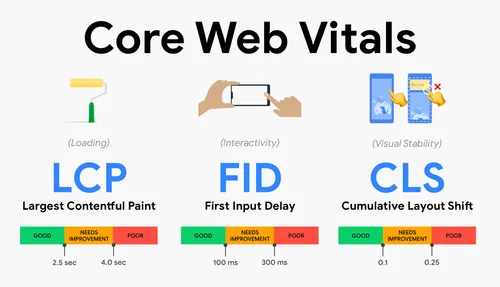
Every client who arrives with a performance problem has already run Lighthouse. They have a score, usually somewhere in the fifties, and a list of twenty suggestions. What they do not have is any idea which two of those twenty matter.
Lab scores are not the metric
Google ranks on field data — real Chrome users, aggregated over 28 days, reported at the 75th percentile. Lighthouse runs a simulated mid-tier phone on a throttled connection in your office. The two correlate loosely and diverge badly on sites with heavy personalisation, cookie banners, or a large share of returning visitors.
Before changing anything, pull the field numbers:
// PageSpeed Insights API returns CrUX field data alongside the lab run
const res = await fetch(
  `https://www.googleapis.com/pagespeedonline/v5/runPagespeed?url=${encodeURIComponent(url)}&key=${key}`
);
const data = await res.json();
const lcp = data.loadingExperience.metrics.LARGEST_CONTENTFUL_PAINT_MS;
console.log(lcp.percentile, lcp.category); // e.g. 3120 "NEEDS_IMPROVEMENT"
If the origin has no CrUX entry, it has too little traffic and you are optimising blind. Install web-vitals and send real measurements to your own endpoint before you spend a week on tuning.
The four changes that did the work
1. Time to first byte, which usually means caching
On four of the six sites, TTFB was over 800ms. That is the floor for LCP: nothing renders before the HTML arrives. Two were WordPress installs querying the database on every request. One was a Next.js app rendering dynamically because a single component read cookies() at the top level.
That last case is worth dwelling on. In the App Router, one dynamic API anywhere in a page's tree opts the whole route out of static rendering. We found it by running:
npx next build --debug
and reading the route table. Pages marked ƒ (Dynamic) that should have been ○ (Static) told us exactly where to look. Moving the cookie read into a client component below a Suspense boundary took TTFB from 840ms to 40ms — the whole page now serves from cache.
2. Making the hero image discoverable
The browser's preload scanner reads the raw HTML before any JavaScript executes. If your hero image URL only exists inside a component that runs on the client, or inside a CSS background-image in an external stylesheet, the scanner cannot see it and the request starts hundreds of milliseconds late.
The fix is unglamorous: put the LCP image in the initial HTML as an <img>, mark it priority, and give it explicit dimensions.
<Image
  src="/hero.jpg"
  alt="Himalayan Café's Jhamsikhel branch at opening time"
  width={1200}
  height={800}
  priority
  sizes="(max-width: 768px) 100vw, 50vw"
/>
priority emits a <link rel="preload"> in the document head. On one project this alone moved LCP by 900ms on mobile.
3. Fonts that block the text
If your LCP element is a headline — and on a marketing site it usually is — the web font is on the critical path. Three defaults cause most of the damage: font-display: block, fonts loaded from a third-party origin, and no fallback that matches the metrics.
next/font fixes the first two by self-hosting and setting display: swap. The third takes a little care: pick a fallback with similar metrics and let Next generate the size adjustment. The result is that text paints immediately in the fallback and reflows imperceptibly when the real face arrives.
4. Client-rendered heroes
A hero that assembles itself in useEffect cannot be the LCP element until the JavaScript bundle downloads, parses and executes. On a mid-range Android over 4G, that is two to four seconds you are choosing to spend.
Render the hero on the server. Reserve interactivity — the parallax, the counters, the carousel — for a client component that hydrates around static content that was already visible.
What did not matter
We measured these carefully and they moved field LCP by less than 50ms each on the sites we tested:
| Change | Field LCP delta |
|---|---|
| Removing an unused CSS framework | −20ms |
| Switching an image CDN | −35ms |
| Lazy-loading below-fold images | ~0ms |
| Reducing bundle size by 40KB gzipped | −45ms |
None of these are bad ideas. They are simply not where the seconds are. Bundle size shows up in Interaction to Next Paint rather than LCP, and lazy-loading below-fold images protects bandwidth rather than the largest paint.
The order to work in
- Measure field data first. If there is none, instrument the site and wait two weeks.
- Fix TTFB. Static or cached HTML is the single highest-leverage change on most sites.
- Make the LCP element server-rendered and discoverable in the raw HTML.
- Self-host fonts with
swapand a metric-matched fallback. - Only then start trimming JavaScript.
On the six rebuilds this year, that sequence took median field LCP from 3.4s to 1.1s. The last three items on a typical Lighthouse list never got touched.
If you want the same audit run on your site, tell us the URL — the first pass is free and you get the findings whether or not you hire us.
Written by
Kabin Bhattarai
Founder & Engineering Lead
Part of the four-person team at nlogn. We publish what we learn on client work — the numbers included.